

Science-based Analysis of
Incremental Exercise Tests
Solution
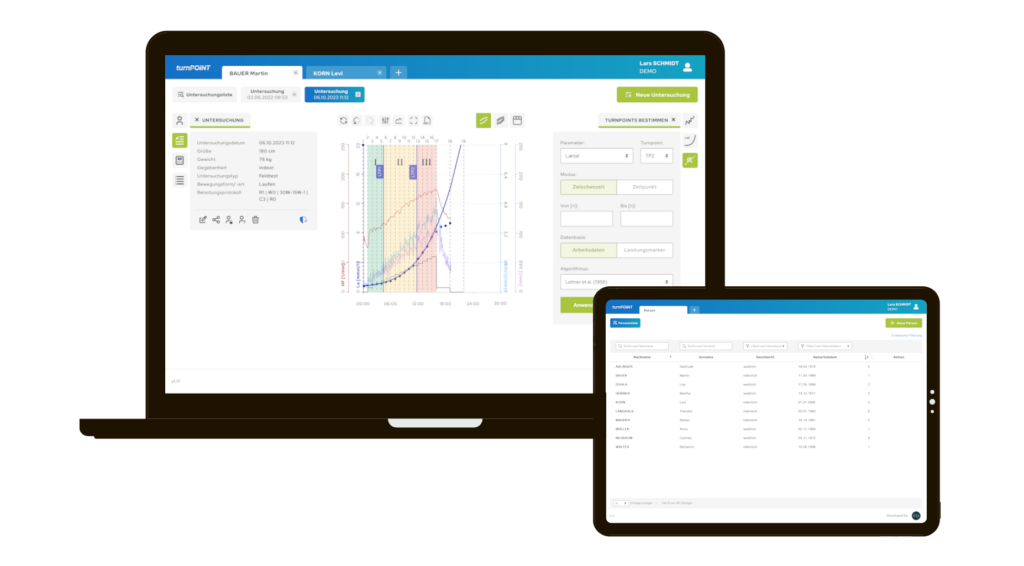
turnPOINT increases the efficiency of endurance training through exact evaluations of stress tests. Innovative algorithms analyse physiological parameters such as heart rate, oxygen uptake and blood lactate concentration and create highly effective training recommendations.
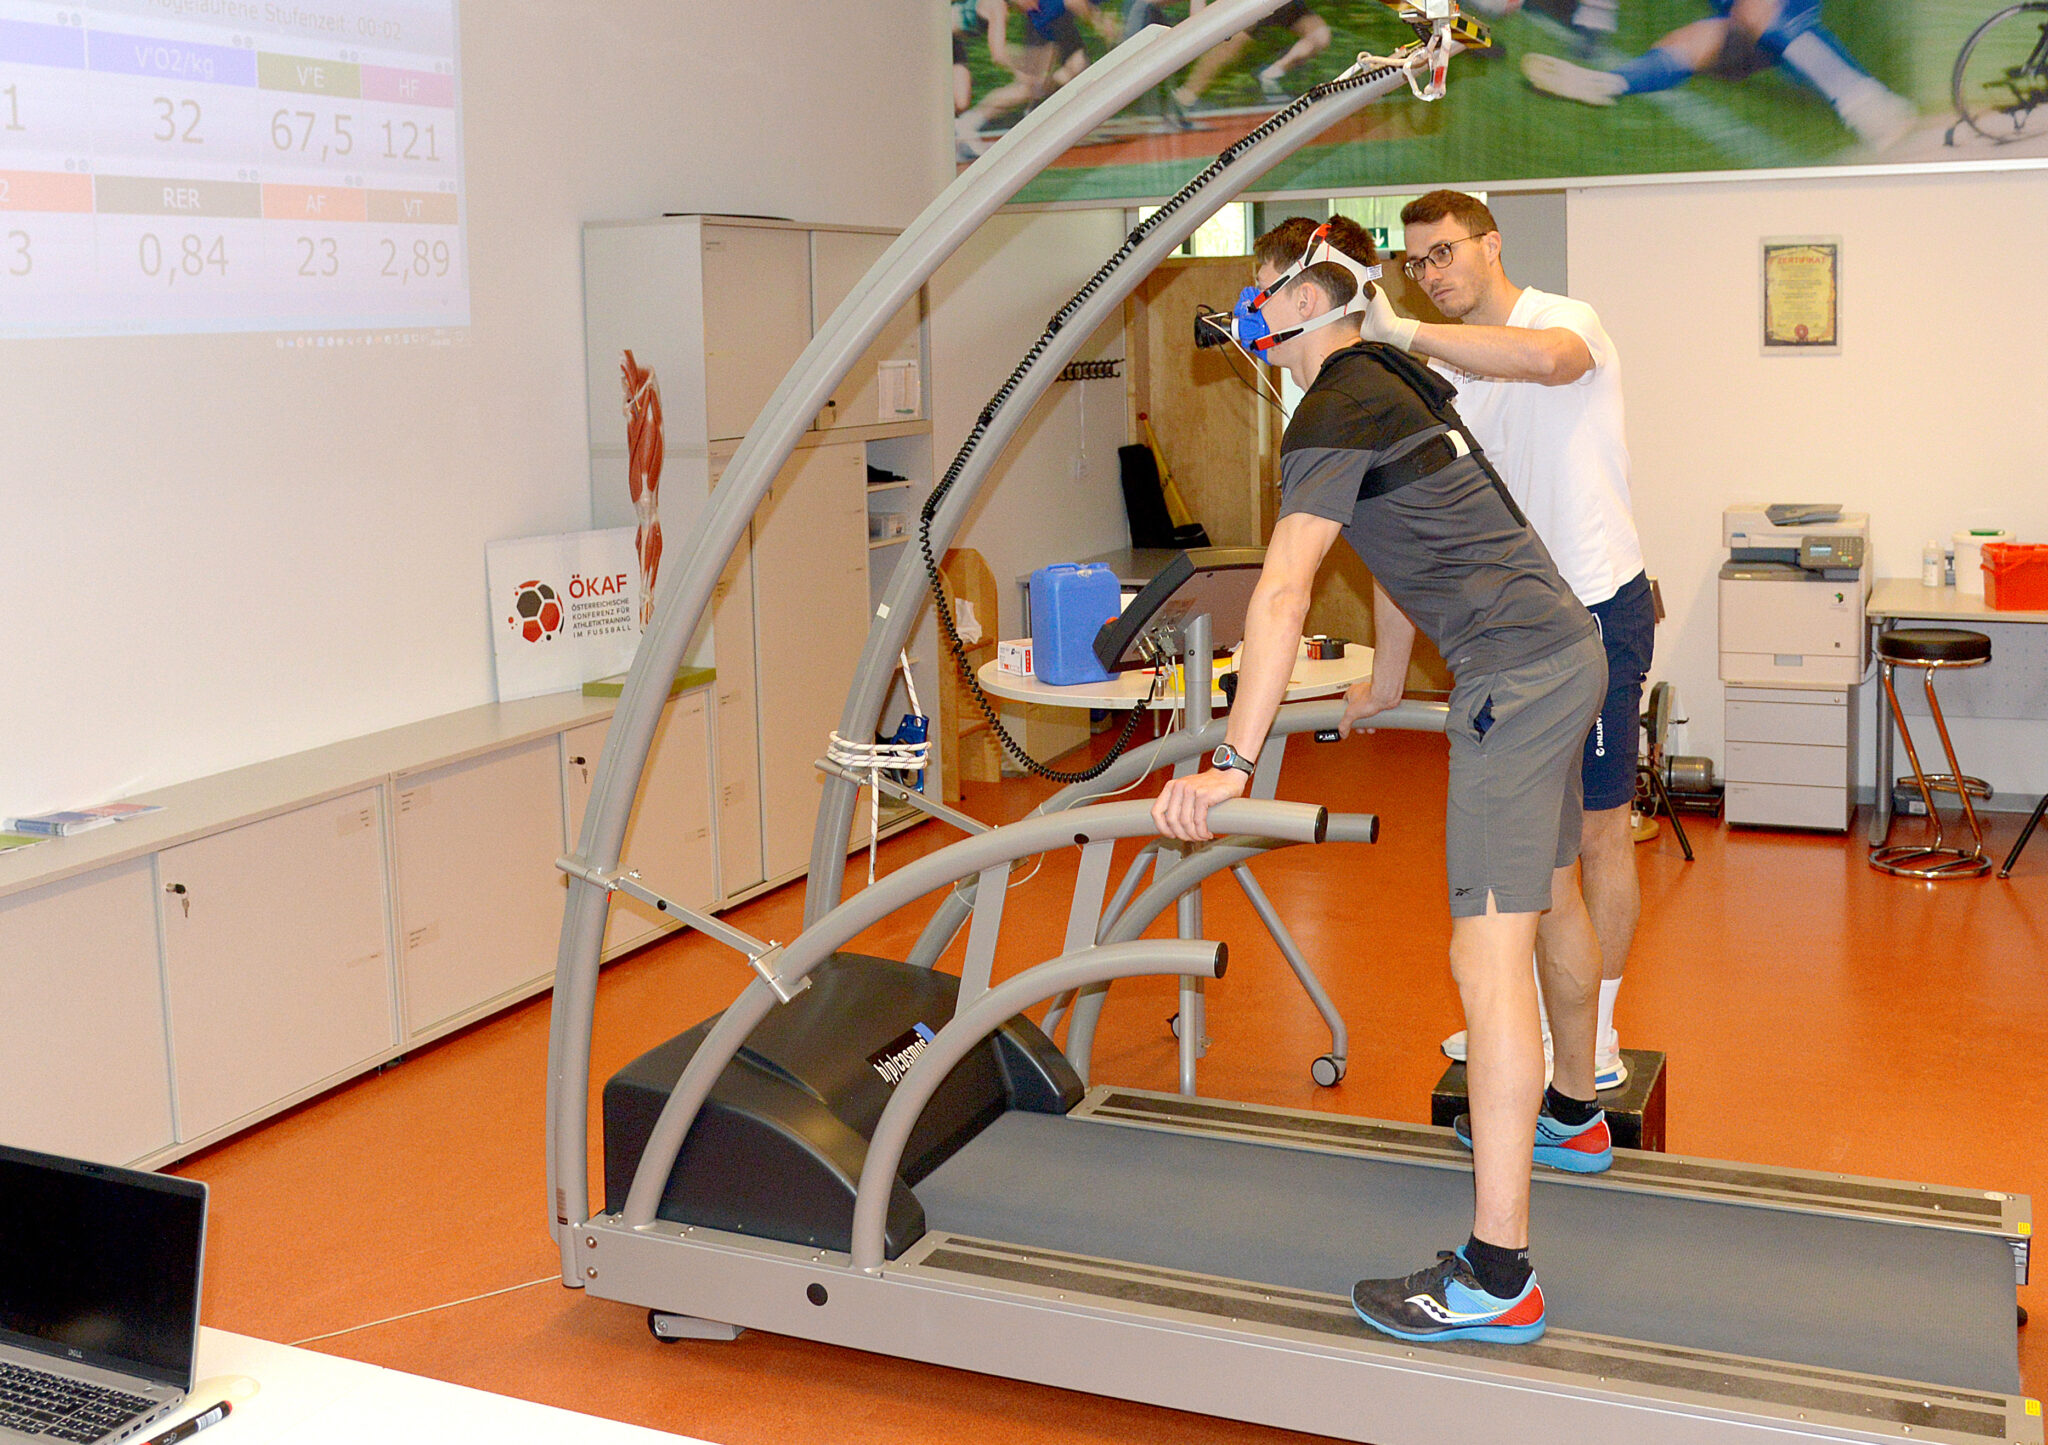
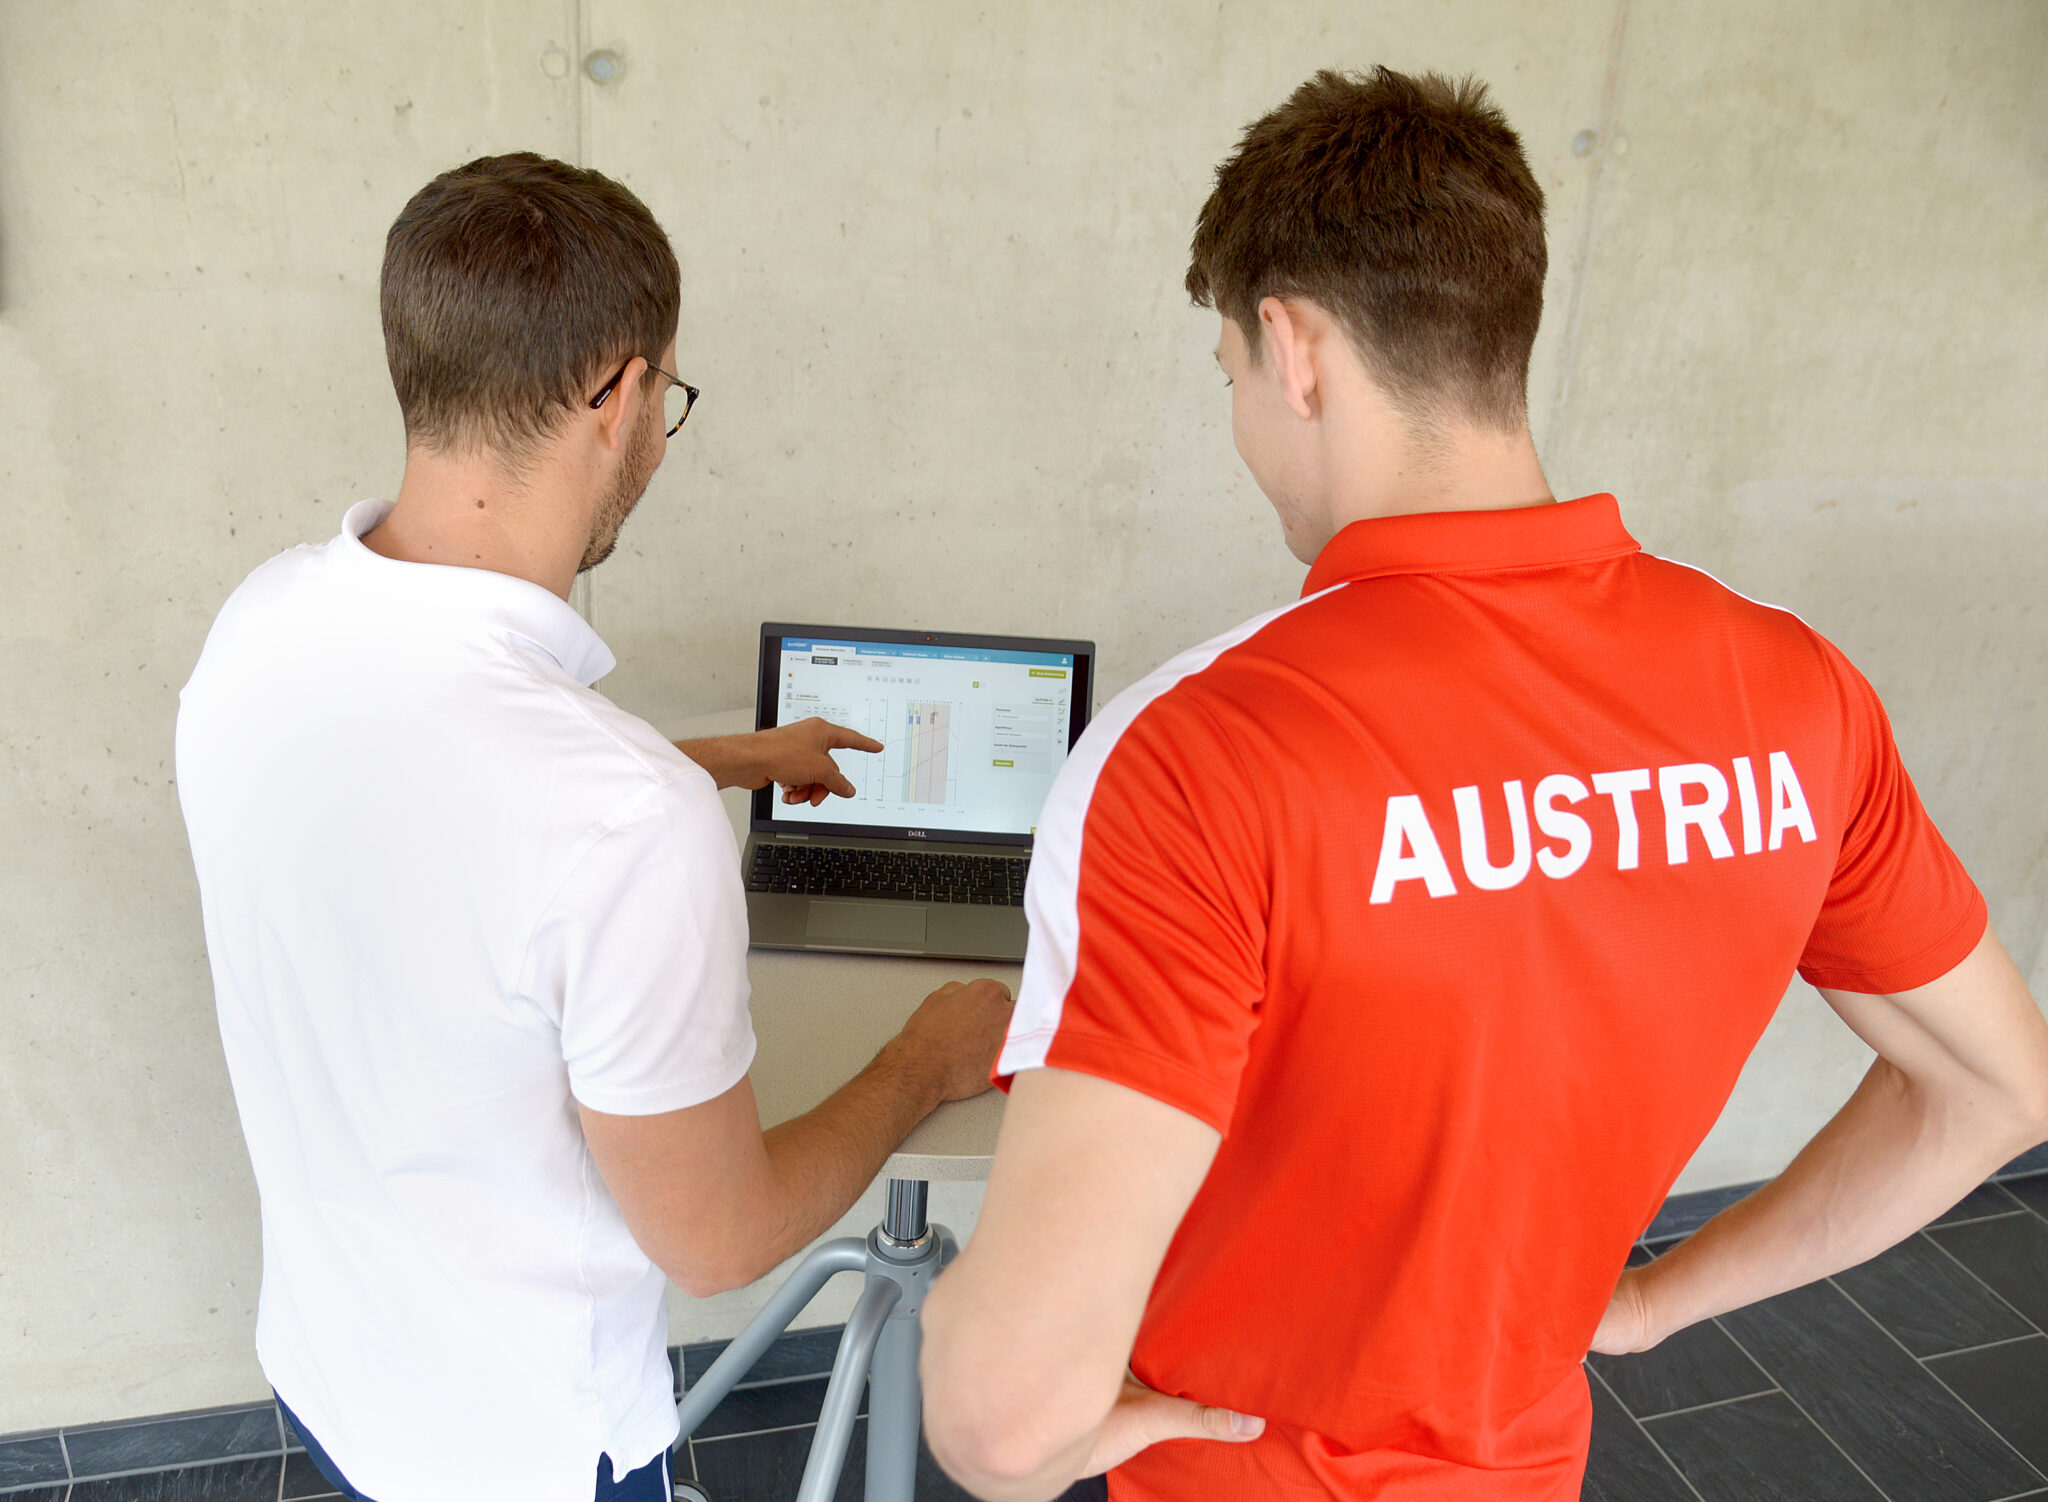
Nationally and internationally successful athletes and teams train according to these analyses. They are also used very effectively in sports and training therapy.
turnPOINT was the result of a research cooperation between FH JOANNEUM, the University of Graz and eSystems Burgsteiner GmbH.
Background
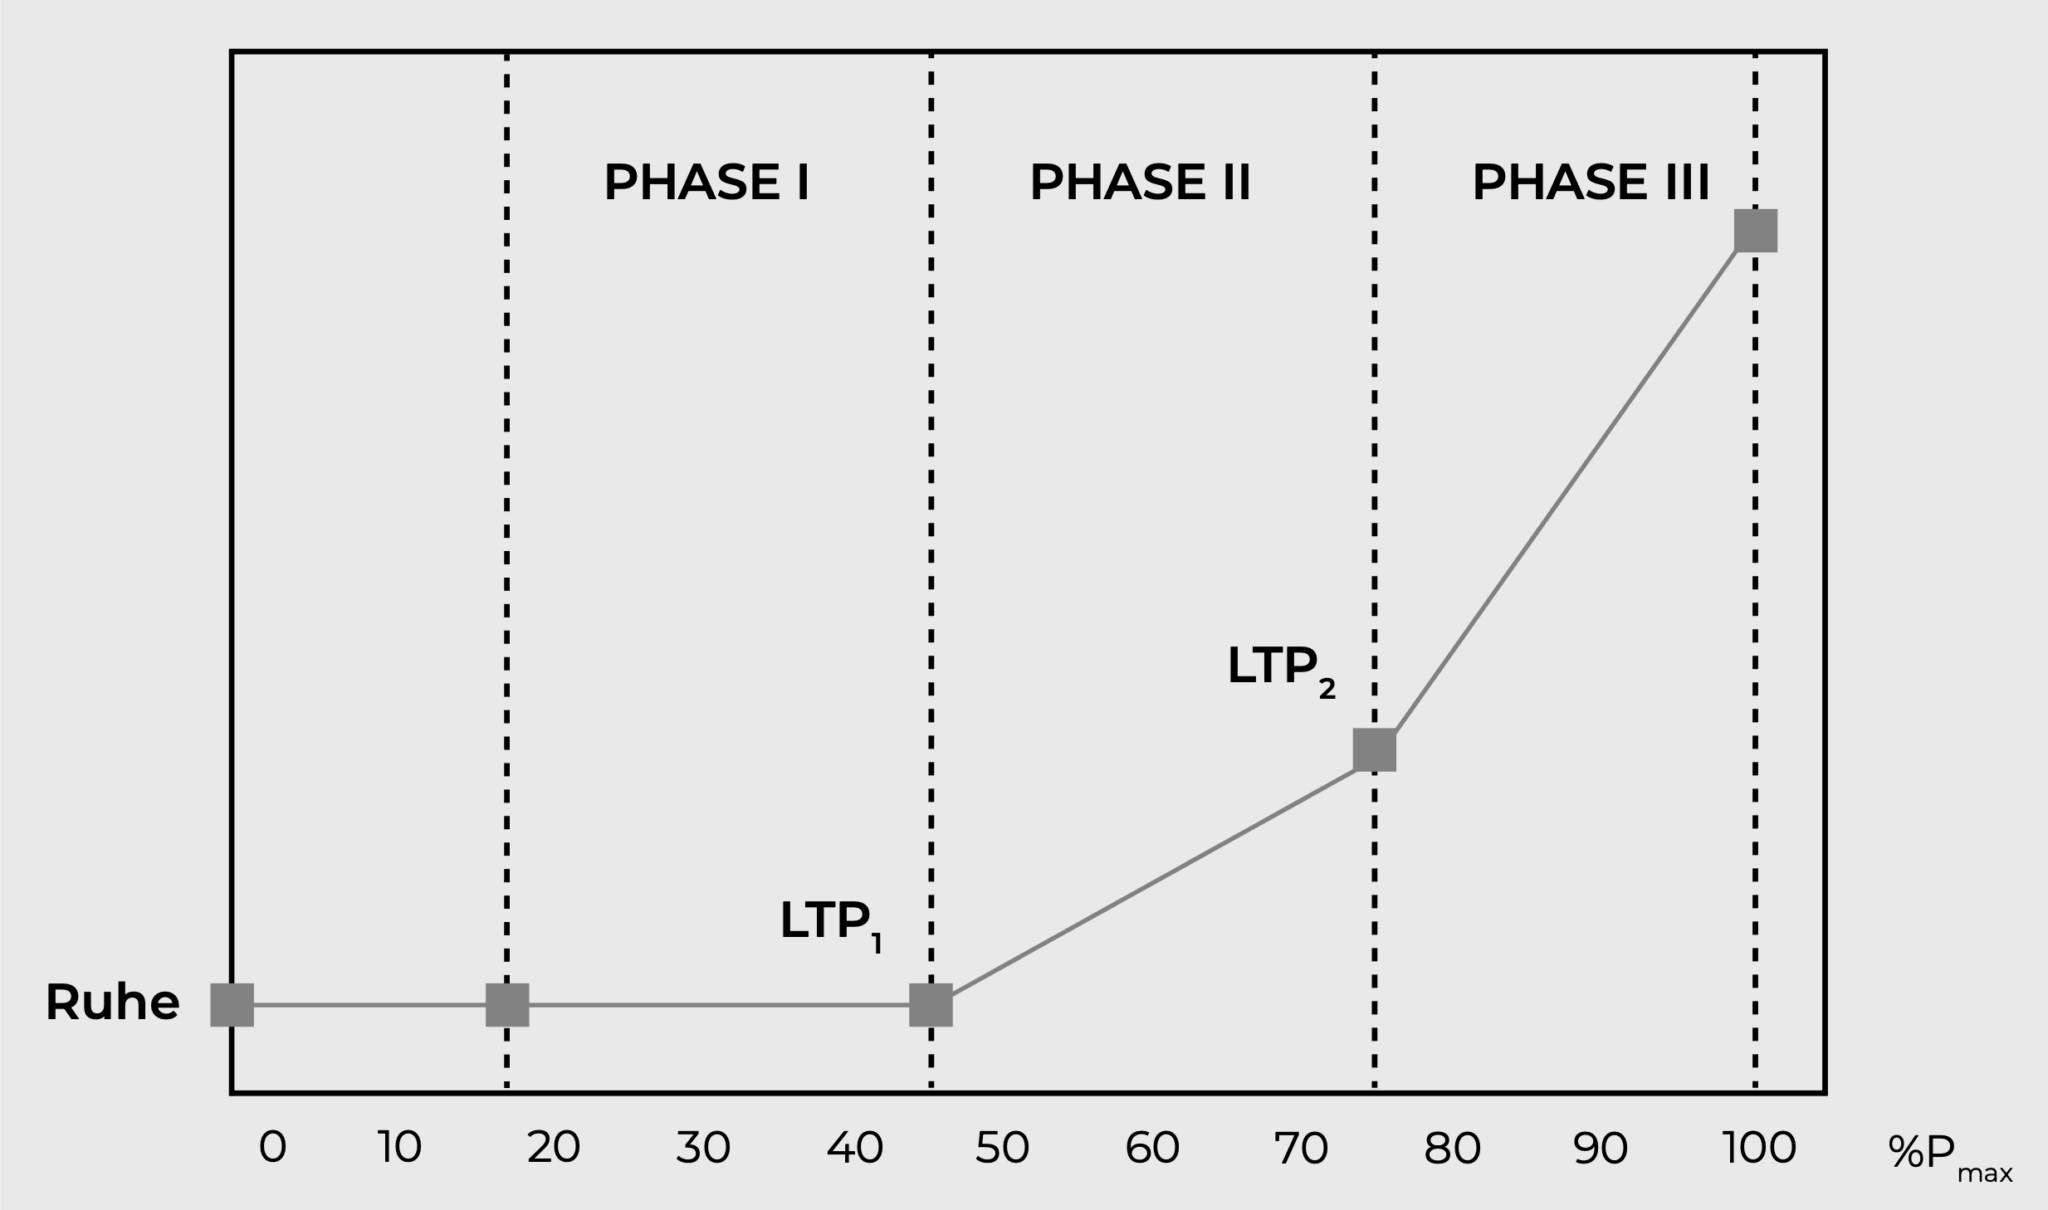
In modern performance diagnostics, sub-maximal and maximal markers of performance are the basis of individual training control. These markers are determined by the behaviour of physiological parameters during stress tests. The physiological parameters recorded in such step or ramp tests show a three-phase progression. The so-called three-phase concept is considered the current scientific standard (Binder et al., 2008; Mezzani 2017; Wonisch et al., 2017):
- Phase I … metabolic equilibrium state in the muscle
- Phase II … metabolic equilibrium state in the whole organism
- Phase III … no metabolically balanced state
Partner
The analytical methods are continuously developed in cooperation with our scientific partners and partners from industry.






Services
The range of services offered by turnPOINT is specifically tailored to customer needs.
Proven and new, innovative analytical methods
Based on proSport and AI algorithms
Web-based System
Mobile data management and analysis, high data security
Inidividualised, graphically appealing reports
Performance development, training areas, etc.
Privacy
The security of personal data is of utmost importance to turnPOINT. The data is stored exclusively on servers within the European Union. All data are protected on the server side according to DIN ISO/IEC 27001 , personal data are additionally encrypted directly in the database by means of current cryptographic algorithms – the measured values cannot be assigned to any person without the key, which only the respective user possesses. This ensures that only the respective key owner can access the individual personal data record by entering a password when logging in.

Basic

Package
100
- 100 Examinations***
€ 199,00
Standard
- 15 User
- Print Report
- Overlaying Curves
- Training zones
- Import of Inventory Data
€ 49,90 MTL.*
Package 300
- 300 Examinations***
€ 299,00
Premium
- 45 User
- Print Report
- Overlaying Curves
- Training zones
- Import of Inventory Data
- 3 User Groups
€ 120,00 MTL.*
Package 1000
- 1000 Examinations***
€ 529,00
* Gross price incl. 20% VAT, minimum term of 12 months, payable annually.
** Data migration of existing examination data/archives (e.g. from ProSport) possible, costs according to effort.
*** Examination packages can only be combined with the matching base package.